Press F12 to open your browser's Developer Tools. (On some keyboards, you may need to hold down the Fn key as well.) The exact UI will be different in different browsers, but the process below is essentially the same.
Clear both the Console and Network tabs by clicking the ⌀ icon near the top of each tab:
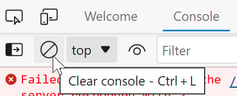
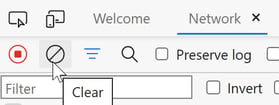
Clearing the logs will remove previous log entries so that we can more easily see the relevant entries.
Cause the issue on the page again (e.g. refresh the page). Capture a screenshot of the full page so we can understand the context.
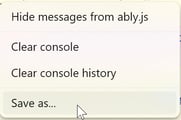
On the Console tab of the Developer Tools, right-click anywhere in the messages, and select Save as.... This will save a .log file.
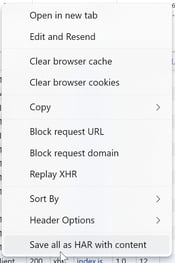
On the Network tab of the Developer Tools, right-click anywhere in the messages, and select Save all as HAR with content. This will save a HAR file.
In newer browsers, you will find an icon to Export the HAR file, so you can use that instead:

The resulting HAR file should have a size of at least 100K (but probably much more).
Please email help@lightningtools.com and send us these three files:
- screenshot of the issue
- Console log file
- Network HAR file
You can redact portions of URLs or other data that is confidential. We mainly need to see the error messages and requests being made by our code.
You may also be able to address the problem yourself if you see that the error is one that's listed in the Troubleshooting section of each of our products:
Lightning Conductor Troubleshooting
Published January 3, 2023
Updated January 13, 2023 to add Lightning Conductor Troubleshooting link.
Updated November 2024 to show Export HAR icon and mention file size.